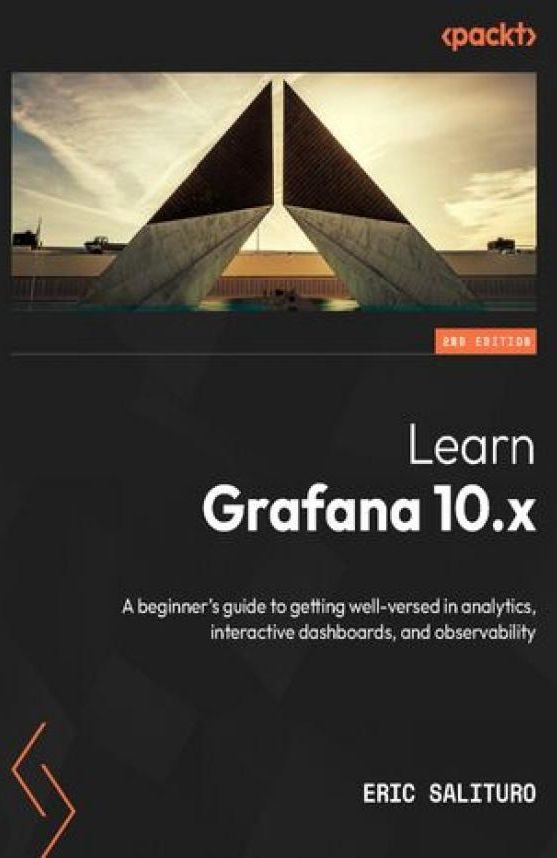

Learn Grafana 10.x. A beginner's guide to practical data analytics, interactive dashboards, and observability - Second Edition


Learn Grafana 10.x. A beginner's guide to practical data analytics, interactive dashboards, and observability - Second Edition - Najlepsze oferty
Learn Grafana 10.x. A beginner's guide to practical data analytics, interactive dashboards, and observability - Second Edition - Opis
Get ready to unlock the full potential of the open-source Grafana observability platform, ideal for analyzing and monitoring time-series data with this updated second edition. This beginners guide will help you get up to speed with Grafana’s latest features for querying, visualizing, and exploring logs and metrics, no matter where they are stored.Starting with the basics, this book demonstrates how to quickly install and set up a Grafana server using Docker. You’ll then be introduced to the main components of the Grafana interface before learning how to analyze and visualize data from sources such as InfluxDB, Telegraf, Prometheus, Logstash, and Elasticsearch. The book extensively covers key panel visualizations in Grafana, including Time Series, Stat, Table, Bar Gauge, and Text, and guides you in using Python to pipeline data, transformations to facilitate analytics, and templating to build dynamic dashboards. Exploring real-time data streaming with Telegraf, Promtail, and Loki, you’ll work with observability features like alerting rules and integration with PagerDuty and Slack. As you progress, the book addresses the administrative aspects of Grafana, from configuring users and organizations to implementing user authentication with Okta and LDAP, as well as organizing dashboards into folders, and more.By the end of this book, you’ll have gained all the knowledge you need to start building interactive dashboards. Spis treści: 1. Introducing Data Visualization with Grafana2. Touring the Grafana Interface3. Diving into Grafana's Time Series Visualization4. Connecting (...) więcej Grafana to a Prometheus Data Source5. Extracting and Visualizing Data with InfluxDB and Grafana6. Shaping Data with Grafana Transformations7. Surveying Key Grafana Visualizations8. Surveying Additional Grafana Visualizations9. Creating Insightful Dashboards10. Working with Advanced Dashboard Features and Elasticsearch11. Streaming Real-Time IoT Data from Telegraf Agent to Grafana Live12. Monitoring Data Streams with Grafana Alerts13. Exploring Log Data with Grafana's Loki14. Organizing Dashboards and Folders15. Managing Permissions for Users, Teams, and Organizations16. Authenticating Grafana Logins using LDAP or OAuth 2 Providers17. Cloud Monitoring AWS, Azure, and GCP O autorze: Eric Salituro is currently a Senior Software Engineer with the Enterprise Data and Analytics Platform team at Zendesk. He has an IT career spanning over 30 years, over 20 of which were in the motion picture industry working as a pipeline technical director and software developer for innovative and creative studios like DreamWorks, Digital Domain, and Pixar. Before moving to Zendesk, he worked at Pixar helping to manage and maintain their production render farm as a Senior Software Developer. Among his accomplishments, there was the development of a Python API toolkit for Grafana aimed at streamlining the creation of rendering metrics dashboards. mniejLearn Grafana 10.x. A beginner's guide to practical data analytics, interactive dashboards, and observability - Second Edition - Opinie i recenzje
Na liście znajdują się opinie, które zostały zweryfikowane (potwierdzone zakupem) i oznaczone są one zielonym znakiem Zaufanych Opinii. Opinie niezweryfikowane nie posiadają wskazanego oznaczenia.

